
Needs Assessment
LMNOP Aviation
Business Unit: Domestic Service Center Network
Assessment Window: 2 months (remote data collection)
Note: LMNOP Aviation is a pseudonym. Proprietary metrics and key information were anonymized.
Challenge
LMNOP Aviation operates one of the largest Domestic Service Center Networks (DSN) and faced significant operational inefficiencies. Leadership initially identified the inefficiencies as a lack of project management knowledge and requested project management training for frontline staff. An organizational scan suggested that the gaps were rooted in systemic environmental issues rather than individuals' knowledge gaps, which led to a full needs assessment.
The organization faces a complex market landscape defined by rising demand for maintenance services, significant parts shortages, and a shifting technician demographic. To remain competitive, the network must maintain high levels of operational efficiency and customer trust.
Target
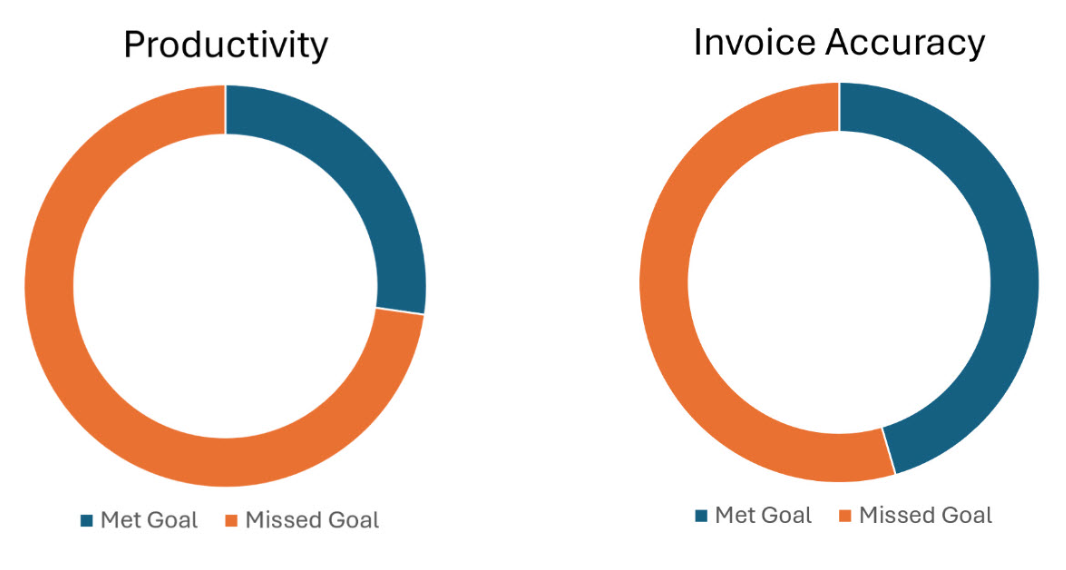
The assessment targeted two primary metrics: Productivity and Invoice Accuracy. Less than one-fifth of locations met organizational goals for both metrics.
Productivity: Potential impact of up to $18 million annually.
Invoice Accuracy: Potential impact of up to $10.36 million annually.
Target: 90% of sites meet both goals
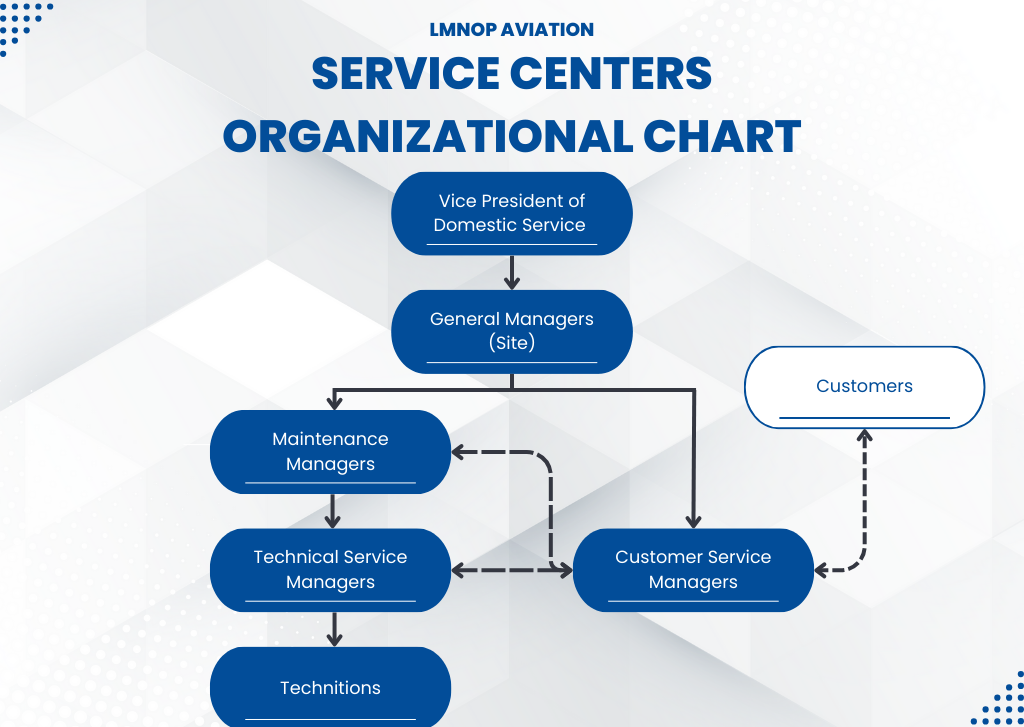
Organizational Analysis
-
Responsible for the strategic oversight of all service center locations.
-
Acts as the primary lead for an individual site. The GM is accountable for site-specific operational metrics, including productivity and invoice accuracy, and ensures that local performance aligns with the broader organizational strategy.
-
Provides oversight for the maintenance department within a site. This role ensures that workflow is steady and that the facility has the necessary resources to meet customer demand.
-
Serves as frontline technical leadership. TSMs are responsible for supervising technicians, managing floor-level productivity, and providing the technical quality control necessary to ensure aircraft safety and compliance
-
Manages the customer experience and the administrative aspects of service delivery. A primary function of this role is to generate and review invoices. CSMs work closely with MMs and TSMs on projects to communicate expectations to clients.
-
The primary performer responsible for the actual maintenance, repair, and modification of aircraft. Technicians are at the center of the productivity metric, as their efficiency directly impacts the organization's turnaround time.
Methods
My team applied several frameworks as part of the needs assessment.
Chevalier's Behavior Engineering Model and Rummler and Brache's Nine-Variable Model provided the structure necessary to categorize our data. This allowed correlation to environmental factors and individual factors for productivity, and to the organizational level or process level for invoice accuracy.
The Five Whys technique was applied after data collection to identify root causes.
A SWOT analysis was used during intervention selection to identify which root causes would have the greatest impact, and then the Multicriteria Analysis was used to prioritize potential solutions.
-
Chevalier’s Behavior Engineering Model (BEM) was the primary diagnostic tool to categorize the root causes of the productivity gap. Chevalier’s variation of the BEM is an update to Thomas Gilbert’s original framework (Chevalier, 2008). It serves as a diagnostic tool to distinguish between environmental factors and individual repertoires. The model is structured as six variables categorized into two levels:
Environmental Supports: These factors are external to the performer and include Information (clear expectations and feedback), Resources (tools, materials, and time), and Incentives (financial and non-financial rewards).
Individual Repertoire: These factors are internal to the performer and include Knowledge and Skills (the ability to perform the task), Capacity (physical or mental ability), and Motives (personal alignment with the work).
Performance gaps can be caused by one variable or multiple variables, though Gilbert noted in Human Competence: Engineering Worthy Performance (1978) that Environmental factors account for the great majority of performance issues.
-
The team used the Rummler-Brache Nine-Variable Model (Nine Boxes) to evaluate the invoice accuracy gap through a wider systemic lens. The Rummler & Brache Nine Boxes provides a systemic view of performance by examining the organization through a three-by-three matrix. This framework allowed us to trace performance disconnects across its three Levels of Performance and its three Performance Variables (Rummler-Brache Group, n.d.).
The Three Levels: Organization Level (the total company), Process Level (how work gets done across departments), and Job/Performer Level (the individual execution).
The Three Variables: Goals (are there clear standards?), Design (is the structure or process logical?), and Management (is performance monitored and supported?).
The strength of this framework lies in identifying misalignments. For instance, an organization may have clear goals at the top level, but if the Process Design is flawed, the Job/Performer will be unable to achieve the desired outcomes regardless of their individual skill level.
-
The Five Whys is an iterative interrogative technique used to explore the cause-and-effect relationships underlying a particular problem (Stefaniak, 2020). The primary goal of this technique is to move past surface-level symptoms to identify the root cause of a performance gap. By repeatedly asking "Why?" (named for the commonly used five whys, though the number is variable), practitioners can peel away layers of symptoms to reveal the systemic or environmental failure that requires intervention.
-
SWOT analysis is a strategic planning tool that evaluates four key dimensions of an organization or situation to inform decision-making (Stefaniak, 2020). These four dimensions are: Strengths, the Internal positive attributes and capabilities that give the organization an advantage; Weaknesses, the internal limitations or gaps that hinder performance; Opportunities, the external or internal factors that the organization can leverage for improvement; and Threats, the external or internal factors that could negatively impact the organization.
-
The MCA is a decision-making tool used to evaluate and prioritize potential interventions when multiple, often conflicting, factors must be considered (Watkin et al, 2011). In a performance improvement context, practitioners establish a set of weighted criteria (such as Impact on Goals, Feasibility, Cost, and Readiness for Change) to score each proposed solution. These weights are determined in consultation with the stakeholders. Once the weights are determined, the interventions are scored, and a final weighted grade is given to each intervention. This systematic approach ensures that recommendations are not based on subjective preference but are aligned with the organization's strategic objectives and resource constraints.
Extant Data Review
My team used internal Power BI metrics for each location. The data analyzed were proprietary metrics that mapped to productivity and invoice accuracy. Additional related metrics were reviewed.
Comparative Sampling Strategy
We utilized those metrics to identify the network’s two "exemplary" locations and the two lowest-performing locations. By focusing interviews on TSMs and CSMs from these locations, the team was able to contrast the environmental supports present in high-performing sites against those missing in low-performing ones.
To review each key role identified by the project sponsors, the team distributed role-specific surveys to GMs, MMs, TSMs, CSMs, and Technicians, receiving over 300 total responses. Interviews and surveys were conducted over three weeks.
Codebook Analysis
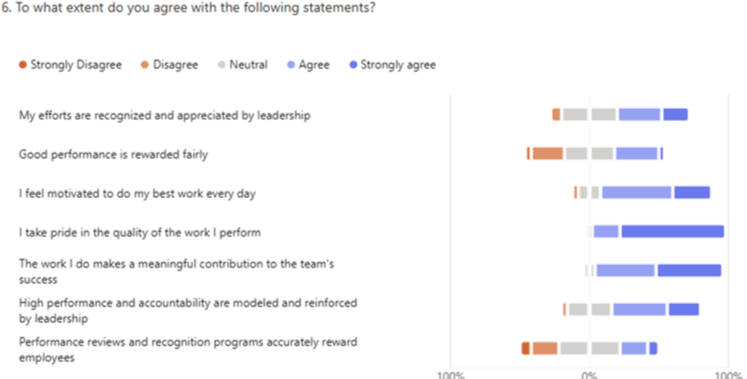
My team developed a codebook based on the BEM and Rummler and Brache’s Nine Boxes to systematically analyze qualitative data from TSM and CSM interviews at exemplary and non-exemplary sites, as well as from organization-wide surveys.
The team coded the interview transcripts and open-ended survey responses using the structured codebook, assigning each statement or observation to the relevant variables
Key
Finding
Differences in performance across sites reflected less about individual effort and more about whether sites are consistently enabled with standard work, usable systems, mentoring, and sufficient role capacity by site leadership.
Causes
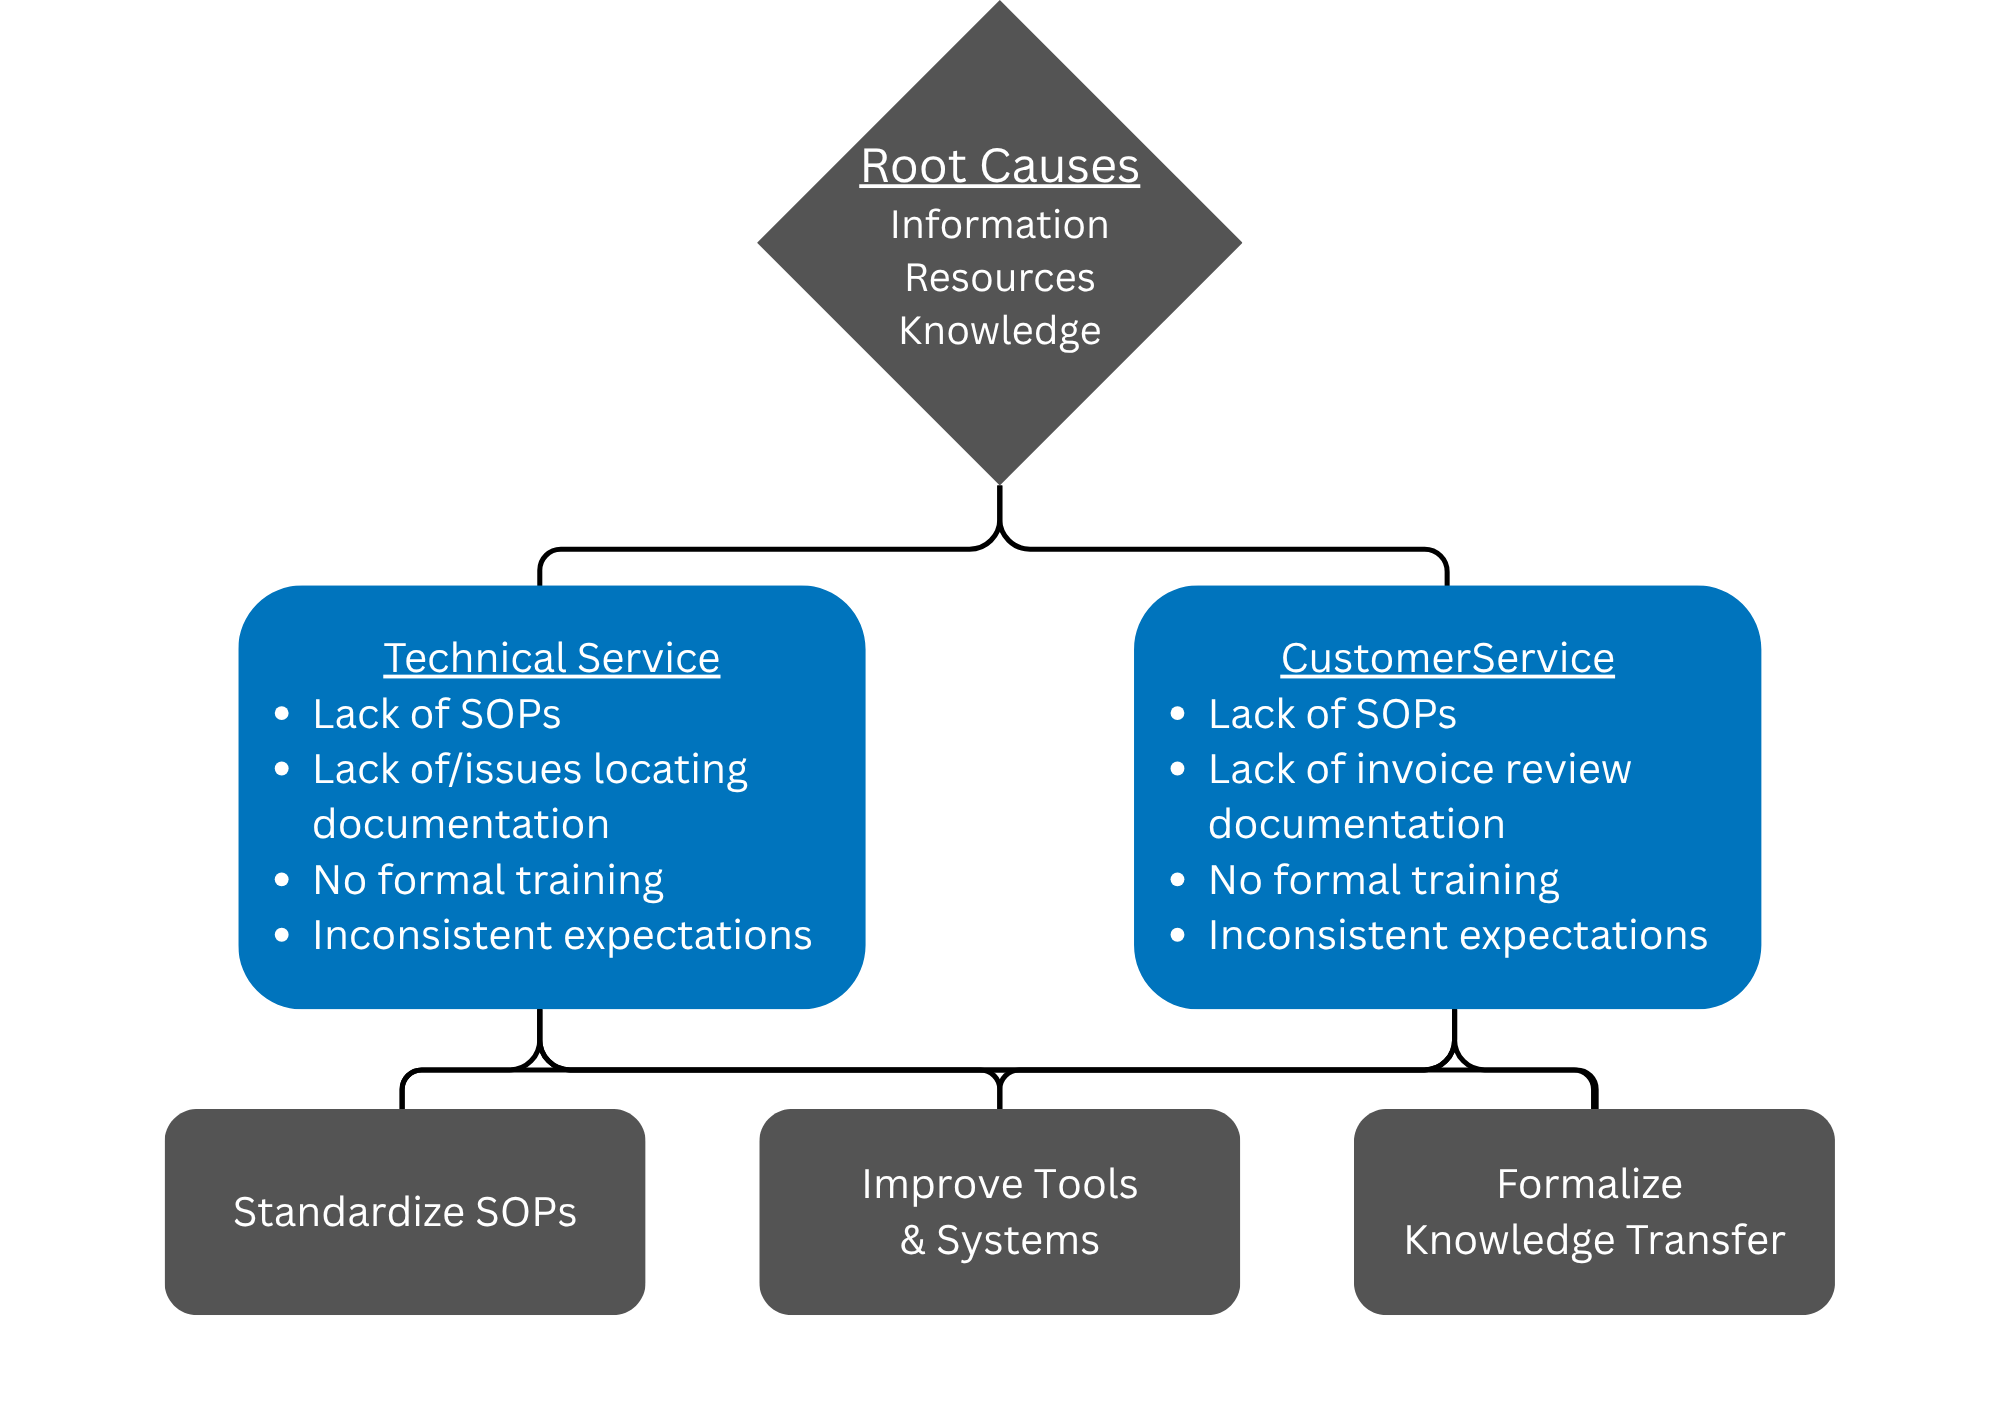
My team applied strategic analysis tools to ensure recommendations were both evidence-based and aligned with LMNOP Aviation’s organizational goals. We started by categorizing root causes into key themes.
Correlations between several root causes for both Productivity and Invoice Accuracy were discovered, which affected the Information, Resources, and Knowledge factors of the BEM.
-
Processes (SOPs) not standardized across sites
Difficulty locating and accessing documentation
No formal knowledge transfer process
Technician grade levels unclear and inconsistent
Computer tools not user-friendly
Physical tools outdated, in poor condition
Physical constraints (hangar design, WI-FI)
Manager feedback quality varies significantly
-
No standard processes for invoice review and quality control
Lack of documentation/guidelines for invoice review
Trial-by-error learning
Responsibilities vary widely by site and headcount
Many CSMs lack technical knowledge
Computer tools not user-friendly
Weak accountability culture
System design allows for weak quality control
Intervention Selection
We then applied strategic analysis tools to ensure recommendations were both evidence-based and aligned with LMNOP Aviation’s organizational goals. We started by categorizing root causes into key themes.
Correlations between several root causes for both Productivity and Invoice Accuracy were discovered, which affected the Information, Resources, and Knowledge factors of the BEM.
We used SWOT analysis to evaluate internal strengths and weaknesses alongside external opportunities and threats. This helped identify leverage points and constraints shaping LMNOP’s ability to improve productivity and invoice accuracy.
To ensure that intervention recommendations were grounded in business reality rather than subjective preference, my team utilized a Multicriteria Analysis to evaluate and prioritize potential solutions.
Rather than selecting interventions in isolation, the team met with a core group of General Managers (GMs) to define the specific standards for success. Using their responses, the team established six weighted criteria to score each proposed solution:
Cost (20%): Will the cost be prohibitive?
Work Stoppage (25%): Can this be implemented without impacting the floor?
Speed (10%): How quickly can the change be implemented?
Sustainability (5%): How sustainable is the intervention?
Impact on Performance metric(s) (20%): Is this intervention likely to impact the productivity and invoice accuracy?
Number of locations affected (20%): How many locations will be impacted by the intervention?
The team applied these weighted criteria to the list of potential interventions.
Recommendations
Primary Intervention Recommendations
These interventions address the root causes affecting both productivity and invoice accuracy across the entire network. The interventions will have the maximum impact on the performance gap.
-
Create network-wide standards for project planning, scheduling, and management; invoice review and quality control; work allocation and assignments; and project communication.
Approach | Working group identifies best practices from exemplary sites and documents standard operating procedures.
Impact | Reduced variation, faster onboarding, clearer expectations
Feasibility | Medium | Leverage exemplary sites
-
Centralize and normalize documentation. In addition, conduct an assessment of computer tools and systems.
Potential Approaches | Retrieval-Augmented Generation LLM agent; Centralized web portal; Knowledge Management System
Impact | Less time wasted, fewer errors pass through
Feasibility | High-Low | RAG LLM can leverage tools already used; assessment & customization of software is time-consuming and expensive.
-
Components of intervention would include a mentoring program (experienced staff paired with new hires), role-specific onboarding paths, and a competency model with a certification pathway for technician grades.
Approach | Setup formal mentorships with experienced/new staff, create role-specific onboarding paths, design a capability model for technicians for each grade level and job description
Impact | Faster time-to-competency, reduced errors, stronger career path
Feasibility | Medium | Pilot program for one group (CSMs)
Second Level Recommendations
These recommendations target network-wide causes that, while critical, are secondary to the systemic failures identified in the primary recommendations. They will impact the performance gap, but less than the primary recommendations, or require implementation of the primary recommendations before implementation.
-
Train managers on effective, consistent feedback while providing regular feedback patterns (weekly or monthly 1-on-1s). Establish recognition programs for excellence.
Impact | Clearer expectations, faster improvement, stronger accountability
Feasibility | High | Minimal cost or time constraints compared to other interventions
-
Review and adjust leadership compensation as applicable. Review COL for locations. Develop a leadership program for aspiring managers. Create clear competency requirements for advancement.
Impact | Less lost institutional knowledge, turnover
Feasibility | Low-High | Vary heavily
-
Appoint site champions to share successes and challenges. Provide role shadowing opportunities. Provide recognition for innovations that benefit the network.
Impact | Less lost institutional knowledge, turnover
Feasibility | Low-High | Vary heavily
Third Level Recommendations
The final level recommendations consist of targeted interventions designed to address site-specific infrastructure needs that do not necessarily apply to the entire network.
-
Review and correct tool issues at locations. This includes reviewing WI-FI connectivity, the number of parts racks, and adding additional tool sheds where applicable. When feasible, evaluate hangar capacity at specific locations.
Impact | Work slowdowns; loss of business
Feasibility | Low-High
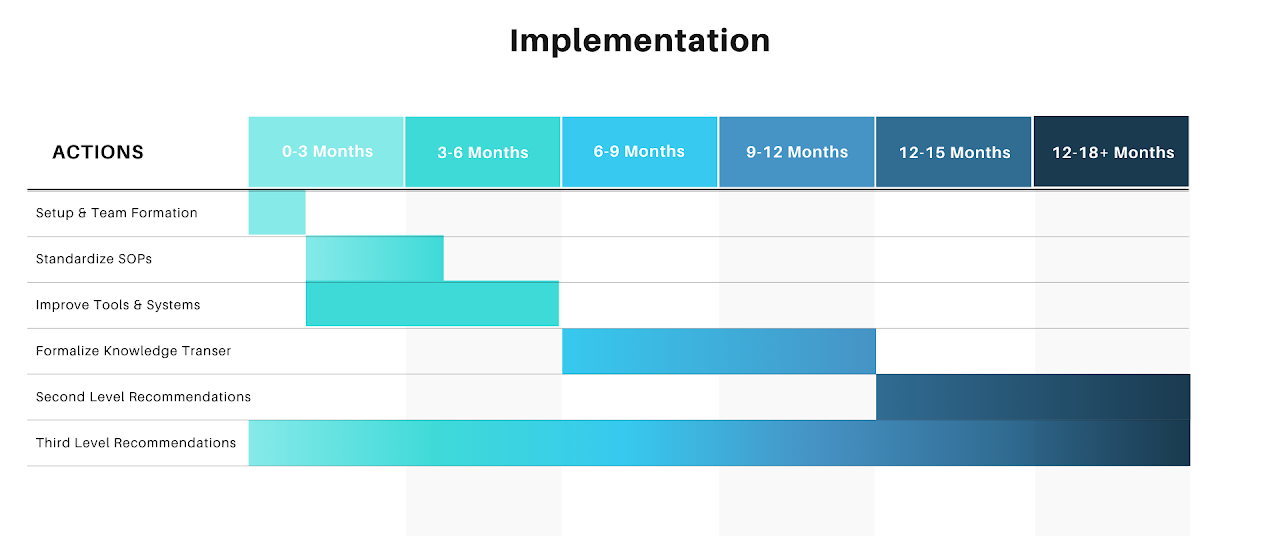
Timeline
My team proposed a phased 12–18 month plan that balances ambition with practicality to deliver early wins. The focus is on three primary interventions, while also providing timelines for second-level and third-level interventions.
References
Chevalier, R. (2008). The evolution of a performance analysis job aid. Performance Improvement, 47(10), 9–18.
Gilbert, T. F. (2007). Human competence: Engineering worthy performance (3rd ed.). Pfeiffer/John Wiley & Sons.
Rothwell, W. J., Hohne, C. K., & King, S. B. (2018). Human performance improvement: building practitioner performance. Routledge.
Rummler-Brache Group (N.D.) The three levels of performance. Retrieved from https://www.rummler-brache.com.
Stefaniak, J. (2020). Needs Assessment for Learning and Performance. Routledge.
Watkins, R., Meiers, M. W., & Visser, Y. L. (2011). A guide to assessing needs: essential tools for collecting information, making decisions, and achieving development results.